Vital energy
Vital energy and bioenergetics
The area where we are most transparent about the limits. Because this is where the market makes the most confusion — and this is where our honesty matters most.
The data, as it is measured.
Beyond RF shielding and food applications, Life Rocks™ is also studied for its behaviour in the field of vital energy. For years we have measured the material with the ATC 330 bioelectronics instrument and the AEV 300 software — on liquid solutions — following the method developed by French engineer Louis-Claude Vincent and later reformulated by Eng. Mattia Zambetti, and with the Bio-Well device — on the human energy field.
These measurements detect electrochemical parameters (pH, rH2, resistance, redox potential) that, in the reference methodology, are interpreted as an indication of the "vital energy" present in a material or solution — expressed as an Ev percentage and as the ratio between the "vital" (Wv) and "entropic" (We) components. Our data show values that are consistent over time on the plate and on the solutions in contact with the composite, collected over years, series after series.

What these are — and what they are not
These measurements are NOT chemical analyses: they do not measure pollutants, microorganisms or substances present. They do not establish edibility or drinkability. And above all: the L.C. Vincent method is not recognized by the mainstream scientific consensus.
We present them as preliminary data and ongoing research — never as proof of therapeutic or health efficacy. Anyone approaching Life Rocks™ for this aspect must know exactly where the measured data ends and where interpretation begins: we draw that line, and we show it.
01Preliminary data — AEV 300 test (July 2017)
Protocol: Bilium solution and distilled water, measurements before treatment and after 2 hours in three conditions — in contact with the Life Rocks™ plate (T2 shielded) or in contact with control materials (silicone, plastic). Constant temperature 37 °C.
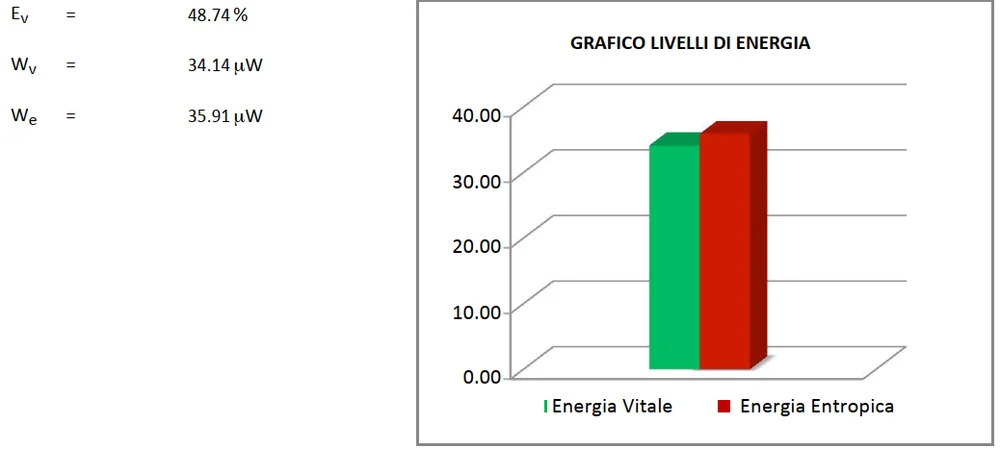
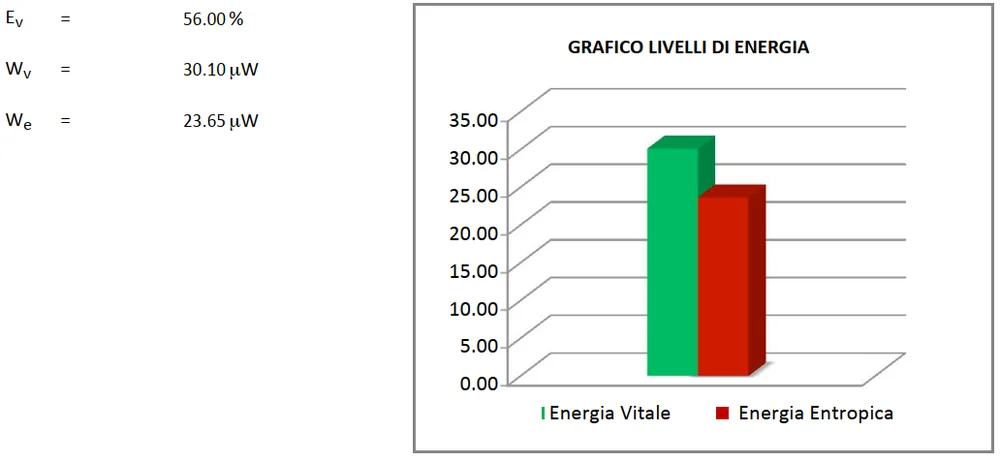
| Condition | Bilium — Ev | Water — Ev |
|---|---|---|
| Baseline (before) | 48.74% | 69.68% |
| After 2 h — Life Rocks™ plate | 56.00% | 71.44% |
| After 2 h — silicone control | 50.43% | 72.10% |
| After 2 h — plastic control | 55.52% | 73.42% |
How we read this data: in contact with the plate, Bilium shows the most marked increase in the vital component (from 48.74% to 56.00%) and a reduction of entropic energy from 35.91 to 23.65 µW. We present it as it is: a single protocol, without statistical repetitions, in which even the controls show variations — which means that this test alone does not isolate the effect of the material. For this reason we treat it as preliminary data of a long series, not as proof.
02Bio-Well observation — human energy field (June 2017)
Protocol: measurement of the energy field with the Bio-Well device on a single subject, before and after 20 minutes of exposure to the Life Rocks™ plate. Same day, distance between the two measurements: 20 minutes.
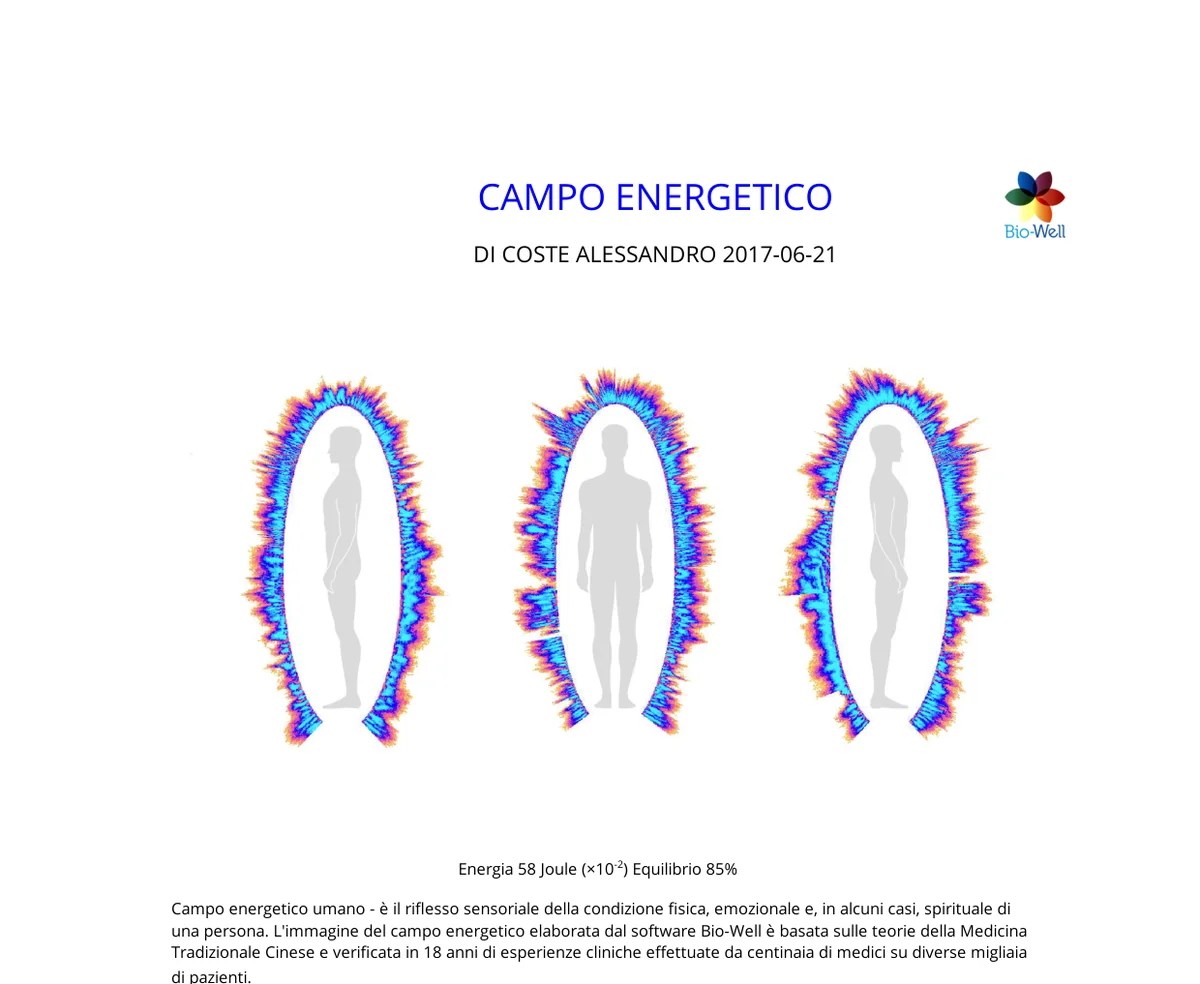
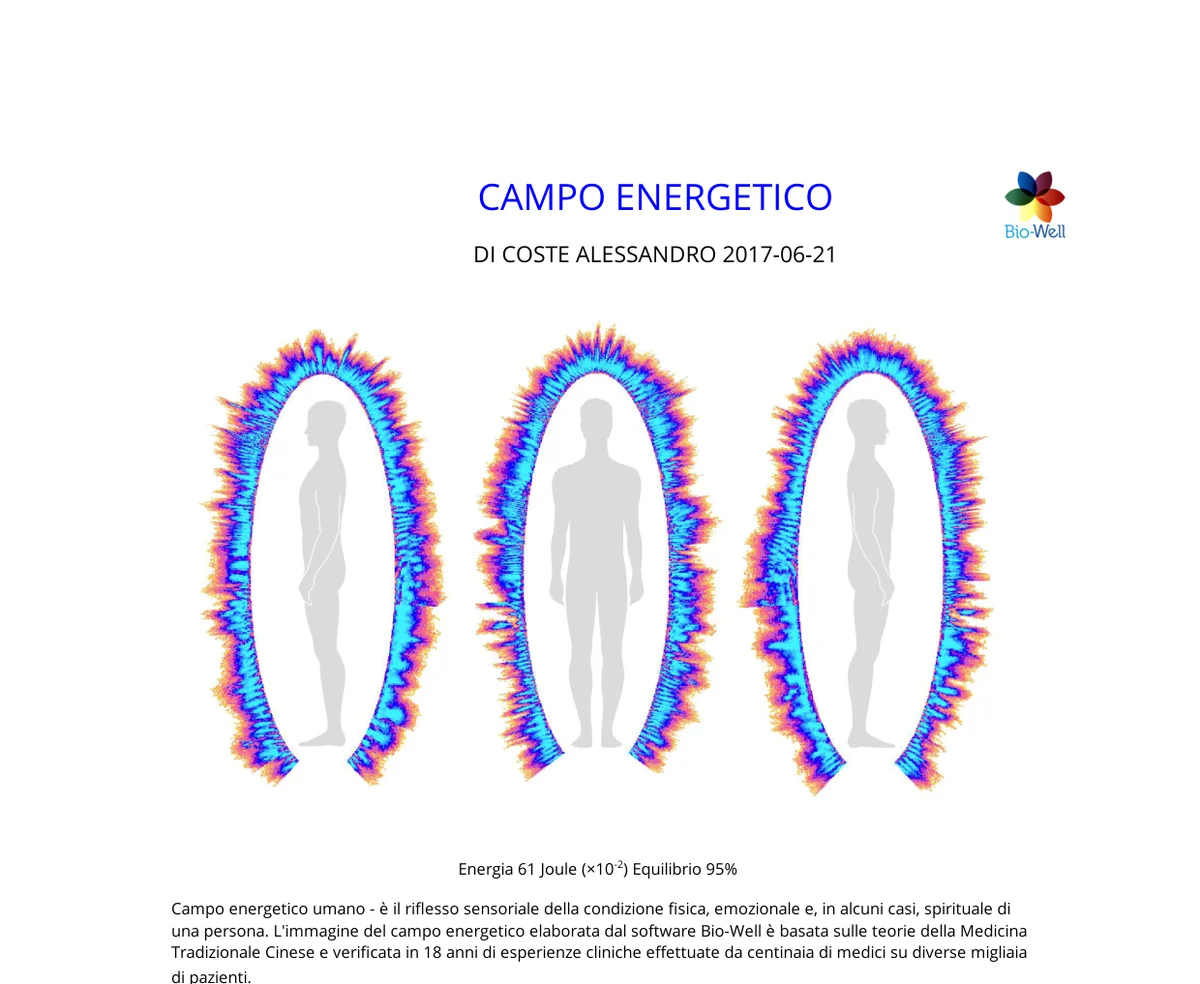
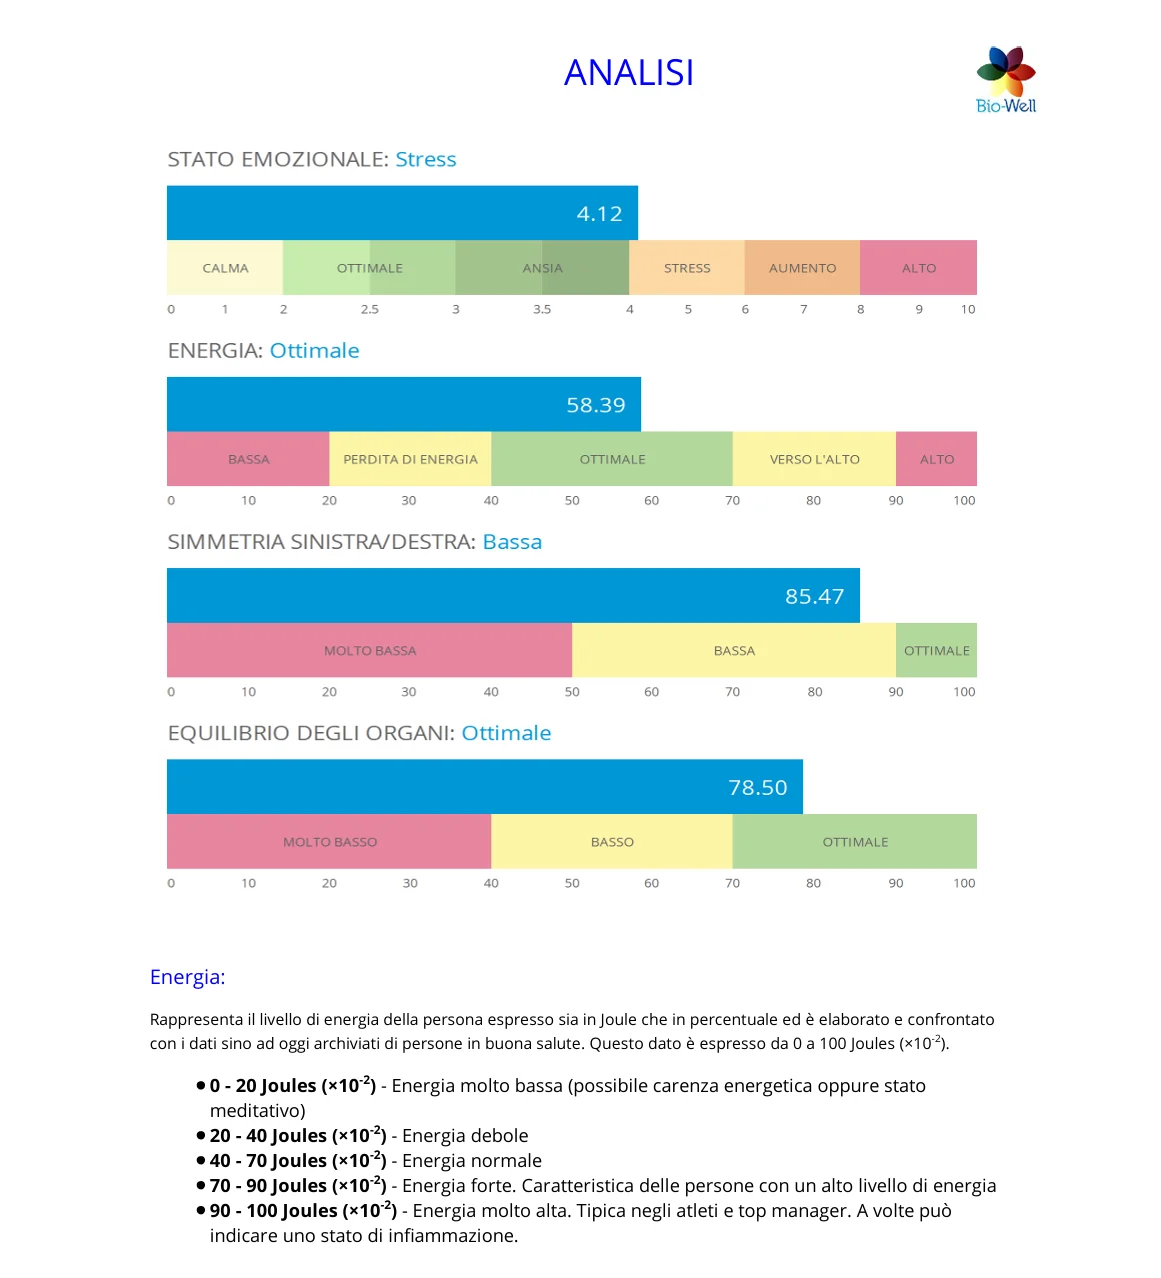
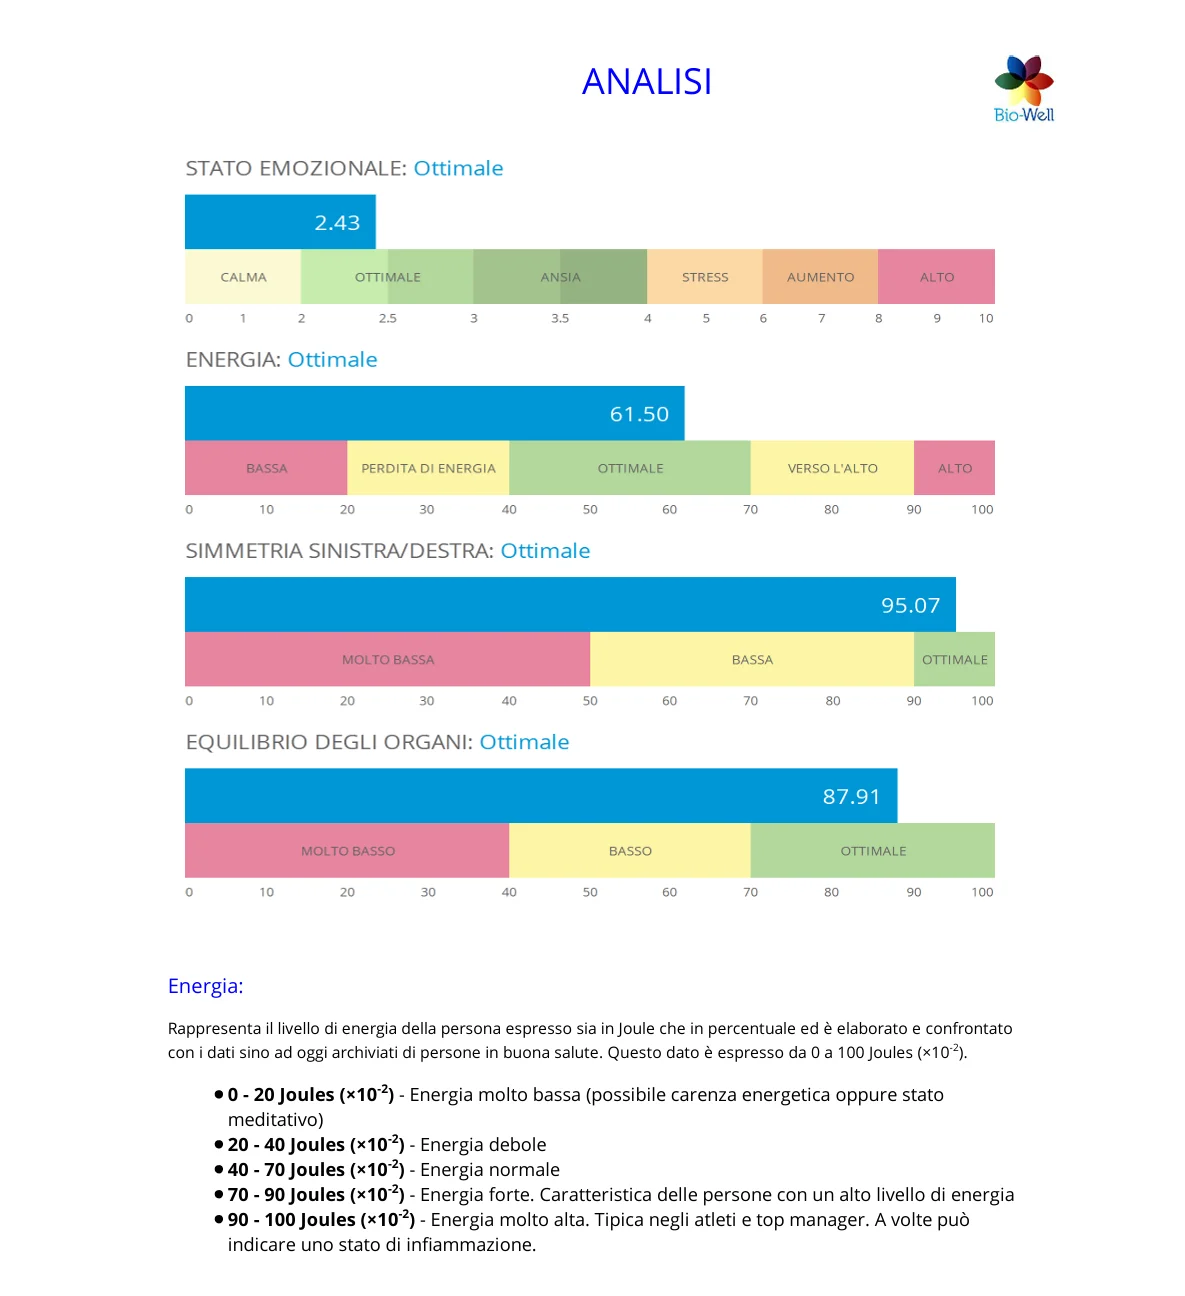
| Parameter | Before | After 20 min |
|---|---|---|
| Energy (Joule ×10⁻²) | 58 | 61 |
| Balance (%) | 85% | 95% |
| Stress level (software classification) | Stress | Optimal |
How we read this data: after 20 minutes of exposure to the plate, the subject's parameters shift toward the "normal" zone of the software scale. We present it as it is: an observation on a single subject, without a control group and without repetitions — it does not demonstrate a causal effect, but it is consistent with what was observed on the solutions in the AEV 300 test. The complete report (22 pages per measurement) is available on request.
Preliminary data, presented as it is.
If you want to see the physical product and the instrumental tests that accompany it, continue from here.